
Orange County 2018 3rd Quarter Market Summary
2018 compared to 2017 For the ENTIRE Orange County Market
Because of the shift that is occurring, there is a lot of discussion about what is happening in the market. A lot of what we are hearing does not line up with the data.
To add context to your conversations, our 3rd Quarter update is going to be in two parts. This is Part 1 and will discuss the Entire Orange County activity.
Part 2 will be our normal review of the 18 select communities from Newport Beach, through Irvine, to Ladera Ranch.
PRINTABLE version of this webspage
Link to OC Report with Detail for ALL of Orange County
Key Take-Aways
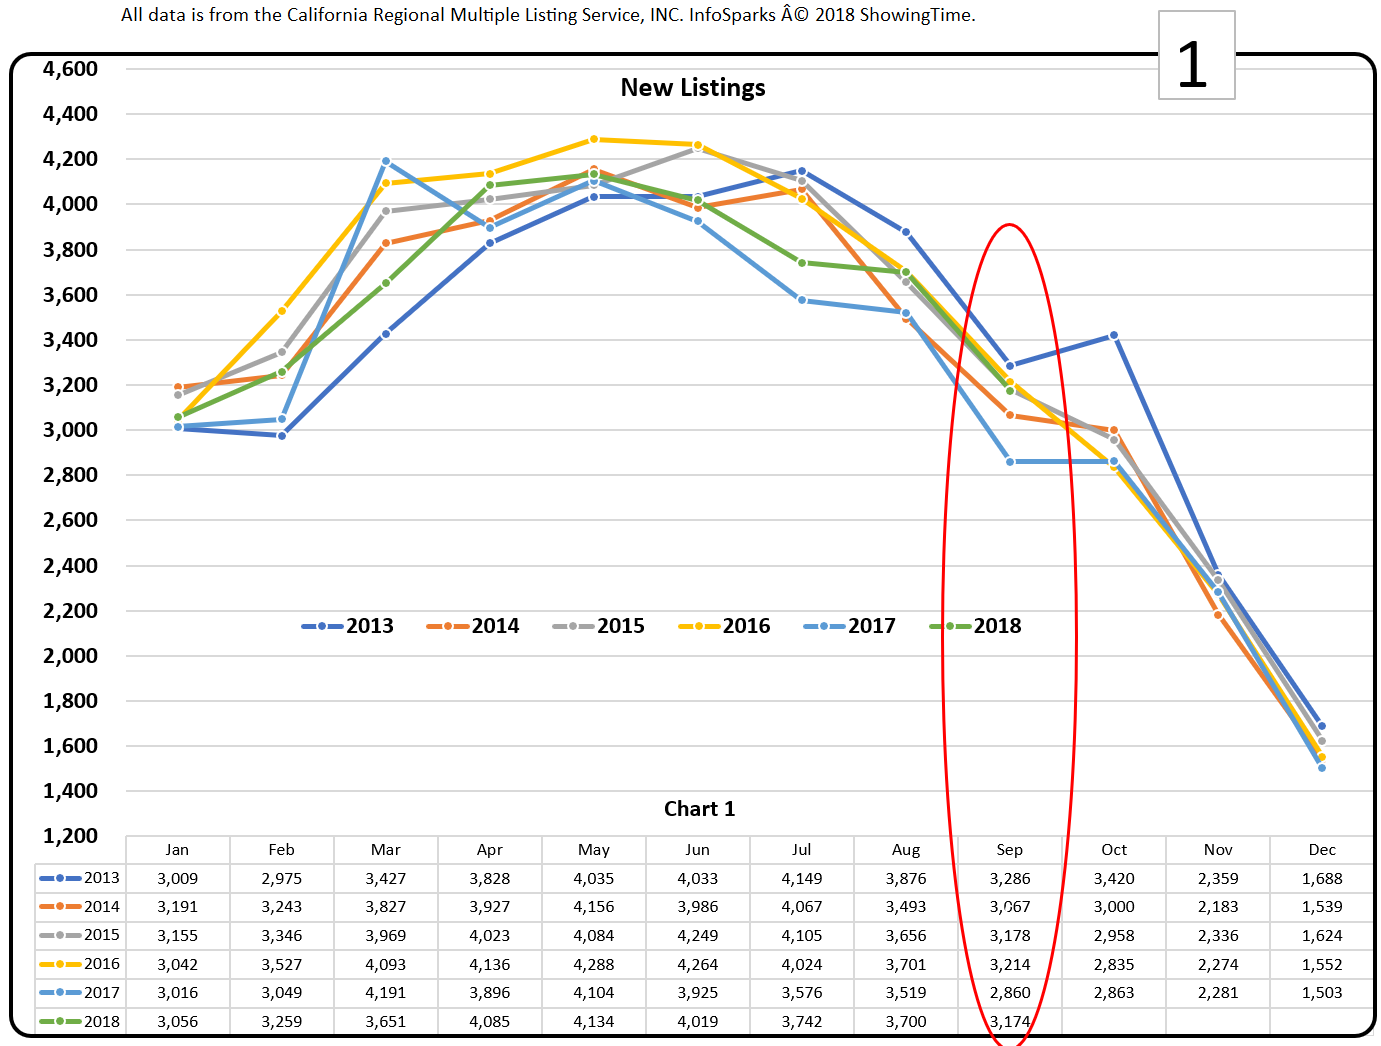
- New Listings in 2018 are only 1% below the average for the prior 5 years. In all of Orange County 32,820 New Listings have been offered for sale as of September 30th 2018.
- The average for the same 9-month period over the prior 5 years is 33,153.
- That means 2018 is only a 1% below the average for the prior 5 years.
- See the New Listing chart and data table below.
- Inventory is Down in most markets / neighborhoods: There are a few communities with slight improvements in inventory but more than 75% of the areas are down with the decline being as much as 39% in some places. The data for the entire OC market shows:
- 16% decreasein the average monthly inventory when compared to the prior 5 years.
- 5.8% decrease compared to 2017.
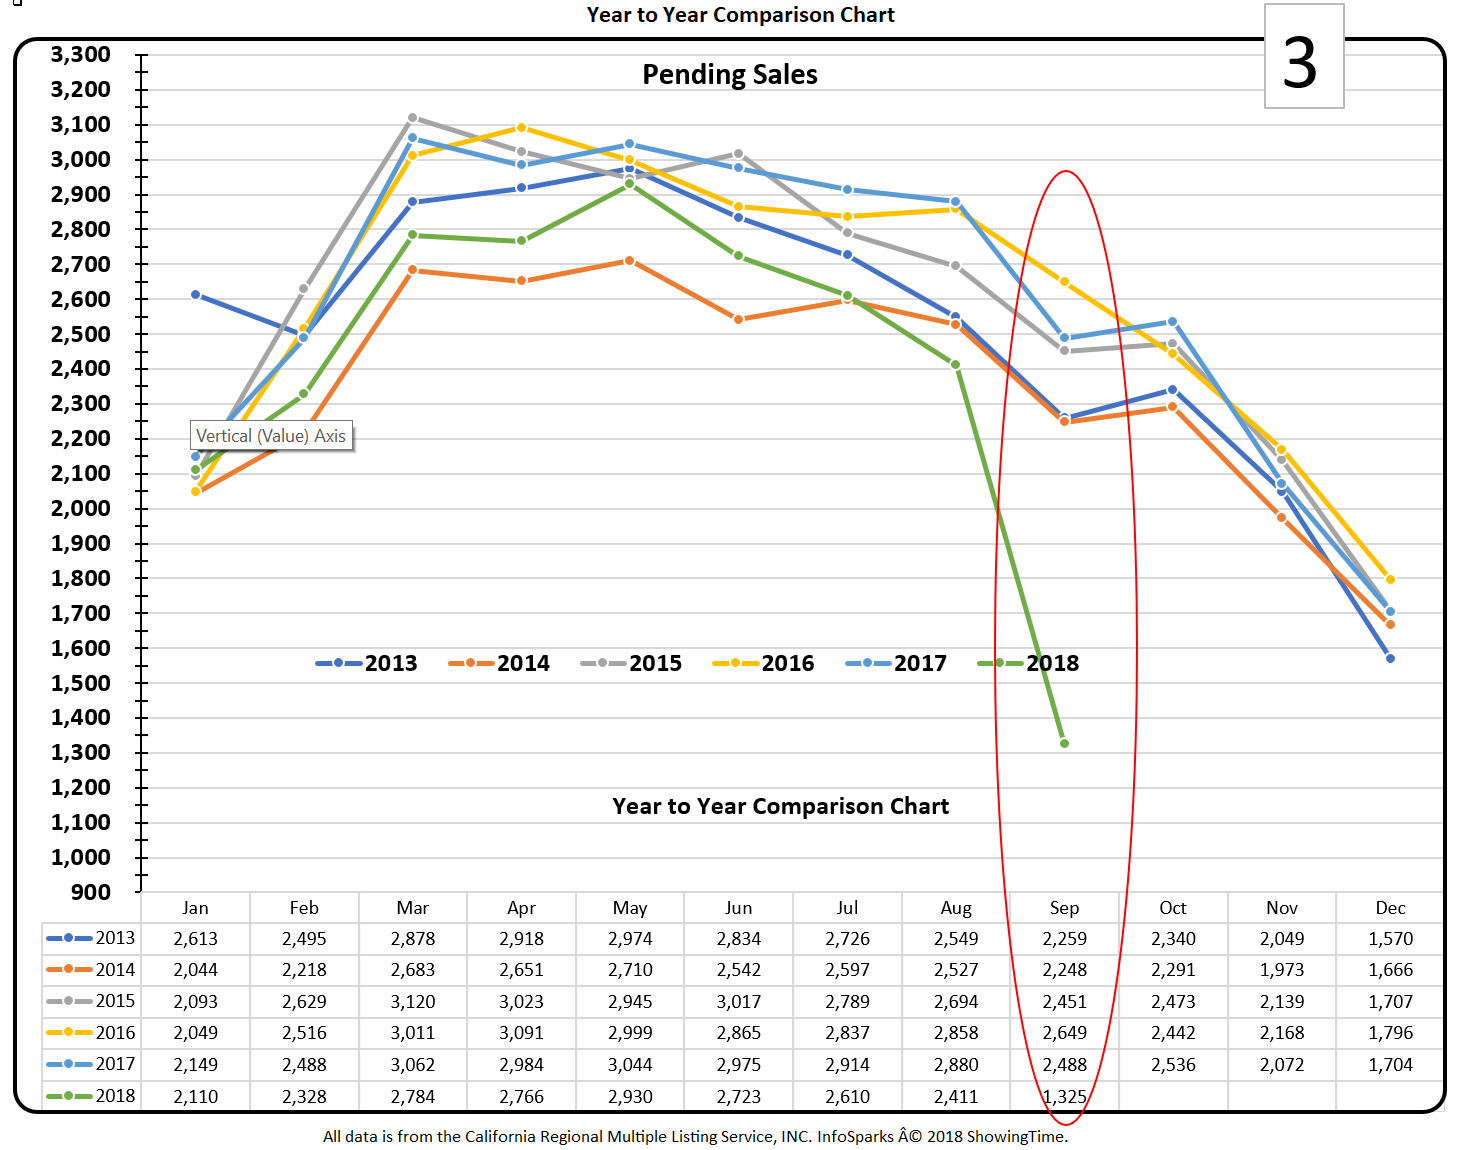
- Pending Sales Total 21,987: It seems to be common knowledge that sales are down. Closings start with contingencies being signed off which result in changing the contract status to Pending.
- The current Year-To-Date total is 9.2% below the 5-year average of 24,217; and
- 12.0% below 2017's total for the first 9 months of the year.
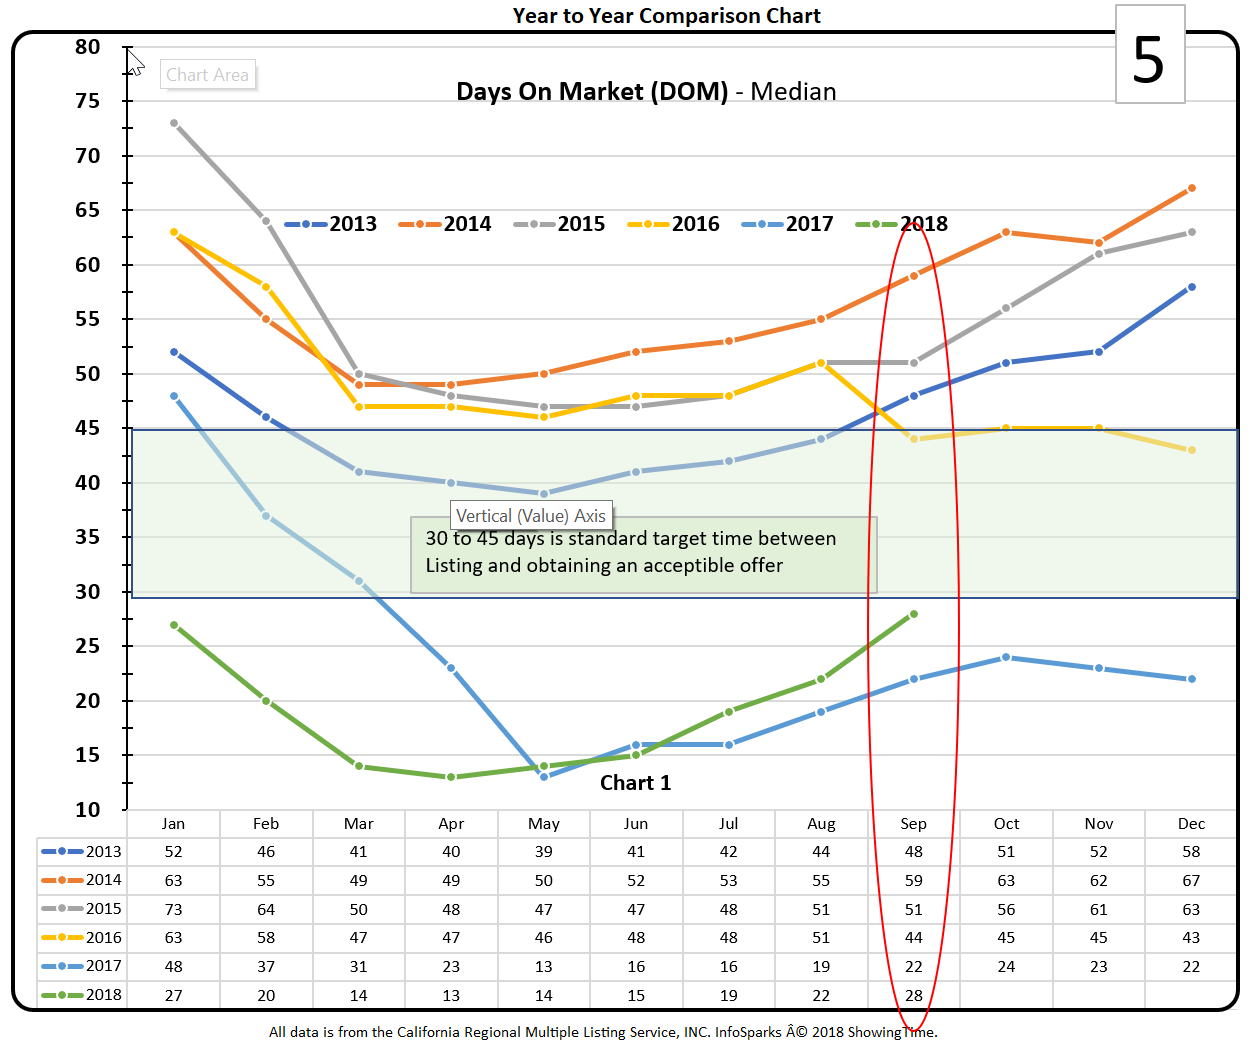
- DOM (Days On Market) is rising.
- For the entire Orange County market DOM is 28 days as of 9/30/18 for those homes that have gone to contract. InfoSparks calculates DOM only on Listings that have gone to contract. It ignores listings that are still in the Active status. One interpretation is properly priced homes sell in the appropriate time frame. Those that are not correctly presented, priced or marketed will take longer. See chart below.
- "Normal" DOM is expected to be 30 to 45 days from the time of listing to the time of receiving an acceptable offer.
- For the past two years the range has been 13 to 25 days. See the chart below.
- In the 18 specific communities we monitor we track both the time it takes to get to contract and the overall average DOM which is now 28 to 66 days inclusive of listings that have not gone to contract.
- Months Supply of Inventory? Is It A Seller or Buyer Market? At the moment and for the foreseeable future we are in a Seller Market...but there is a shift that needs to be monitored...see the chart below.
- Prices UP 4.1 & 2.4% Respectively
- The smaller sized homes in each product segment saw appreciation of 4.1%.
- The larger sized home in each product segment saw appreciation of 2.4%
CHARTS AND COMMENTARY
Inventory is Low to Moderate just about everywhere.
InfoSparks the data source provided to realtors through the MLS is the source for the data and charts displayed for the entire Orange County Market. The first chart shows OC inventory is not low or high for this time of year. It is trending up. Even though the tend line looks like the supply is about to go way up, as noted above inventory in total is down almost 20%. If this trend line continues we will see the volumn of inventory increase.
Inventory
(Active at End of Month)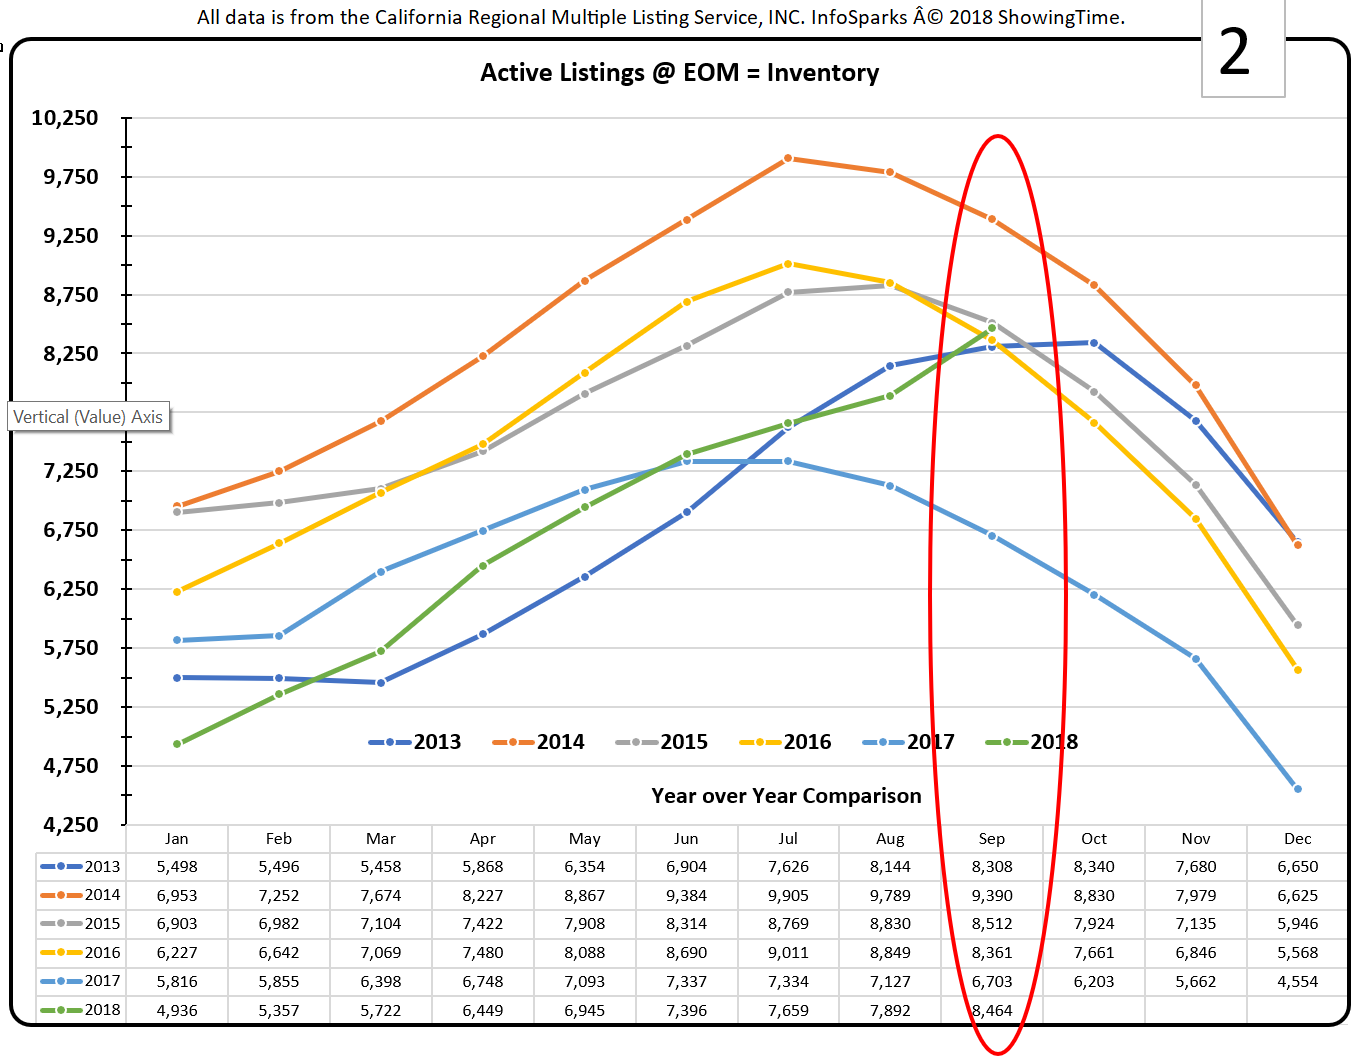
New Listings
As noted above the actual quantity of New Listings throughout the year is 1% below the average number of New Listings through the first 9 months over the past 5 years
Pending
Listing status starts with Active Listing. When a Contract is entered the status changes to Active Under Contract. It remains in that status during the contingency period.
When the contingencies are signed off the status is changed to Pending. During this stage cancellation is rare and cancellation can be costly to the canceling party.
As a leading indicator, if Pending Sales are low, Closings will also be low as seen in the second graph below.
Closed Sales
Closing shown in the current month follow the Pending Sales results of the prior month.
Days On Market (DOM)
Much discussion is occurring about a market slow down! We would like to suggest that the slowdown is really a correction to an overheated pace of absorption.
It has long been known that a new listing will get the most market attention in the first 21 days. If properly priced it should receive an Acceptable Offer between 30 and 45 days. If an offer is not received it is time for a price reduction!!!
The data for DOM provided by InfoSparks only considers the homes that received an offer and went to contract. It does not allow for the overpriced or poorly presented homes that languish on the market.
We have seen the DOM in the low teens as seen in the chart below. The market has risen to 28 days, still low by common standards or practice but double the break-neck pace we have seen.
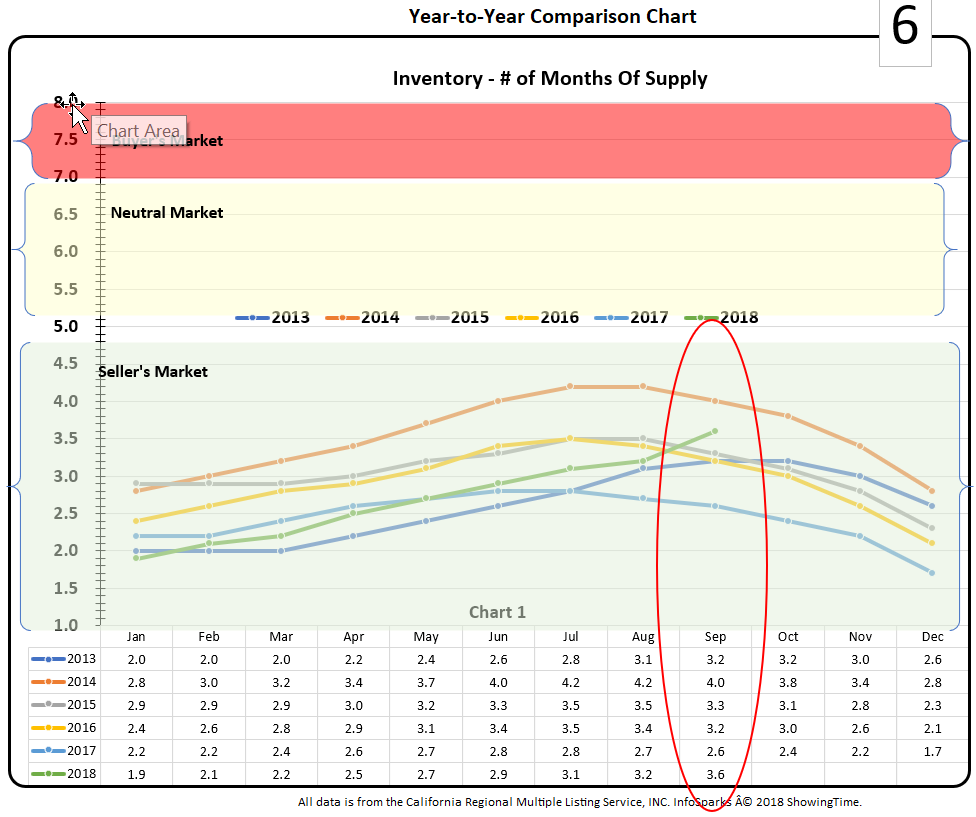
Months Supply of Inventory
Seller or Buyer Market?
Drum Role Please...now for the $1,000,000 Question!
Is it a Seller's Market or a Buyer's Market?
The answer is: It is still a Seller's Market but trending towards being Neutral market.
5 months or less of inventory is a Seller's market
5 to 7 months of inventory is a Neutral market
7 months or more of inventory is a Buyer's market
The next chart shows we are firmly in the middle of the Seller’s Market zone. However, we are trending up when seasonally we should be trending down…something we must keep and eye on. In our 18 target communities we monitor high-end homes in Newport, Coto and Ladera Ranch. We also include Dove Canyon.
In each of these communities there are sections that are Neutral markets and Buyer markets. The switch was made quite suddenly. In some cases, in the course of one month, they went from being in the Seller’s zone to Buyer’s zone.
The point is the higher end homes in some areas are experiencing the slower market absorption.
COMPLETE COMMUNITY REPORTS
3rd Quarter Result for 2018 by community.
Each is a full report for the specific neighborhoods. If you want to discuss the Results for your neighborhood, please contact us. It would be our pleasure to discuss them.
You can find the SUMMARY TABLES that rank each community by activity at this link.
You can sign up for our 90-day Market Snapshot Newsletter for other communities BY CONTACTING US and letting us know which communities are of interest.
AND you can sign up for our Quarterly reports or request custom reports for any city, master plan community, or neighborhood in California.
CLICK on each link to review a community:
- Newport - West Bluff / SAH SFR Single Family Residential (SFR)
- Irvine - Turtle Rock.........SFR 1500 sf & larger
- Irvine - Turtle Rock.........Condo 1100 sf & larger
- Irvine - Woodbridge........SFR 1500 sf & larger
- Irvine - Woodbridge........Condo 1400 sf & larger
- Irvine - WestPark............SFR 900 to 3200 sf
- Irvine - StoneGate...........Condos 1500 sf & larger
- Irvine - Portola Springs....SFR 1500 sf & larger
- Irvine - Portola Springs....Condo 1500 - 3000 sf
- Foothill Ranch.................SFR 1500 sf & larger
- Portola Hills....................SFR 1500 sf & larger
- Coto de Caza...................SFR $600,000 to $999,000
- Coto de Caza...................SFR $1,000,000 to $2,000,000
- Ladera Ranch .................Condo 1100 to 1800 sf
- Ladera Ranch..................Condo 1801 sf & larger
- Ladera Ranch..................SFR 1500 to 3000 sf
- Ladera Ranch..................SFR 3001 to 4650 sf
- Baker Ranch..................SFR 1500 to 4000 sf
- Costa Mesa West Side............SFR 900 to 3,000 sf (call or email for report)
We maintain data on about 32 neighborhoods and can develop a report for any neighborhood in California.
Next Report:
Our next newsletter will be in Part 2 of this 3rd Quarter Report and Focused on our regular 18 communites.
What to expect:
- Inventory is rising
- While the entire OC market may remain a Seller's market, there will be areas, most probably the higher end communities, that become Neutral or even Buyer markets.
- Expect to see the new home communities feel the pinch with slower absorptions and softer pricing.
Contact: Joe Richter 949 769-2000
949 677-7722 (cell & text)
JoeR@HanoverRealtyGroup.com
JRichter@HanoverDevelopment.com
Copyright © 2017 · All Rights Reserved · HanoverDevelopment.com
CA CLB B-861134 ~ CalBRE 01744150 ~ CalBRE 01980301 ~ OR REA 201008092