
Orange County 2018 Year-End Market Summary
2018 compared to 2017 For Select Market Segments
The shifting market continues, there is a lot of discussion and some concern about what is happening in the market. We will open with some comments on the entire OC market but drill down to the local neighborhood level.
Fortunately, we get an assist with the Overall Orange County comments from the annual Chapman University Economic forecast that was presented in December. We do make some references to their report. Specifically, Volume 37, Number 1
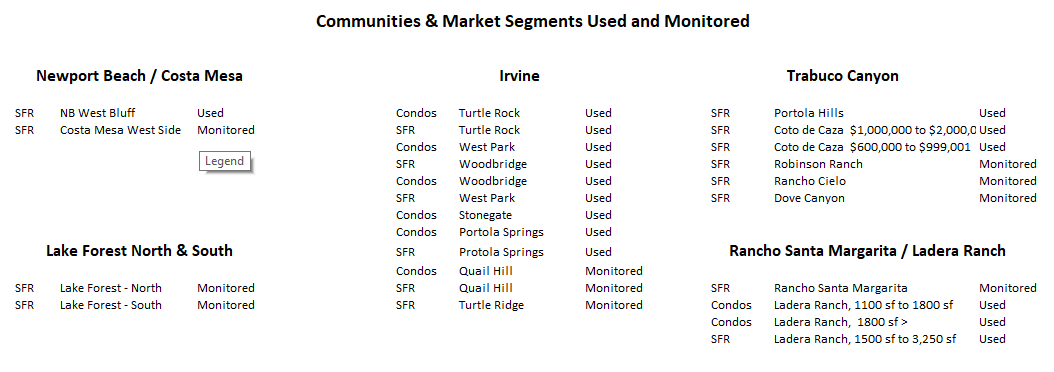
This newsletter is focused on the primary neighborhoods we work in and review monthly. This is an artery of the market that runs from Newport Beach, through Irvine, Lake Forest, Trabuco Canyon, Rancho Santa Margarita, to Ladera Ranch.
PRINTABLE version of this webspage
Link to ALL 22 Summary Pages for ALL of communities that support these comments
Key Take-Aways
- Chapman University says....
- Inventory is rising but...
- DOM (Days On Market) has returned to more normal levels...
The shifting market continues, there is a lot of discussion and some concern about what is happening in the market. We will open with some comments on the entire OC market but quickly drill down to the local, neighborhood level.
Fortunately, the annual Chapman University Economic forecast was presented in December. We do make some references to their report. Specifically, Volume 37, Number 1.
We have been a fan of their work for more than 30 years. They predicted the housing bubble in 2003 and continued to do so until the crash even though other universities scoffed until 2007. In fact, at one point, UCLA's forecast headline was "There's no 'Bubble' in LA".
This newsletter is focused on the primary neighborhoods we work in and review monthly. The select communities that are subject of this report run from Newport Beach, through Irvine, to Ladera Ranch.
DETAILS
1. Chapman University
Chapman University says that portions of the County are already in a Buyer’s Market condition. They say there is a direct almost infallible correlation between inventory levels going above 3.5 months and prices dropping 9 months later.
They were surprised with the reliability of this relationship. They are reporting the county's average inventory as of November 2018 is up to 4 months of inventory as compared to 2 months in 2017 and 2.4 months in 2016.
They attribute the slowing sales to RISING MORTGAGE RATES and successive years of RELATIVELY HIGH RATES OF APPRECIATION without a correction.
They are forecasting slower national and county economic growth with slowing appreciation and slower sales in both the new home and resales markets.
They predict appreciation levels of resales to remain positive but drop to an average 2% in 2019 compared to the 5%+ we have experienced over the past several years.
2. Inventory On The Rise
Inventory is rising in the 22 select communities that we have prepared market specific summaries for. These show year-over-year Inventory has risen in 2018 relative to 2017, sometimes sharply.
In most markets / neighborhoods however, because Inventory in 2017 was so low, Inventory remains below 2015 and 2016 levels.
To demonstrate our thoughts we will use samples from several communities.
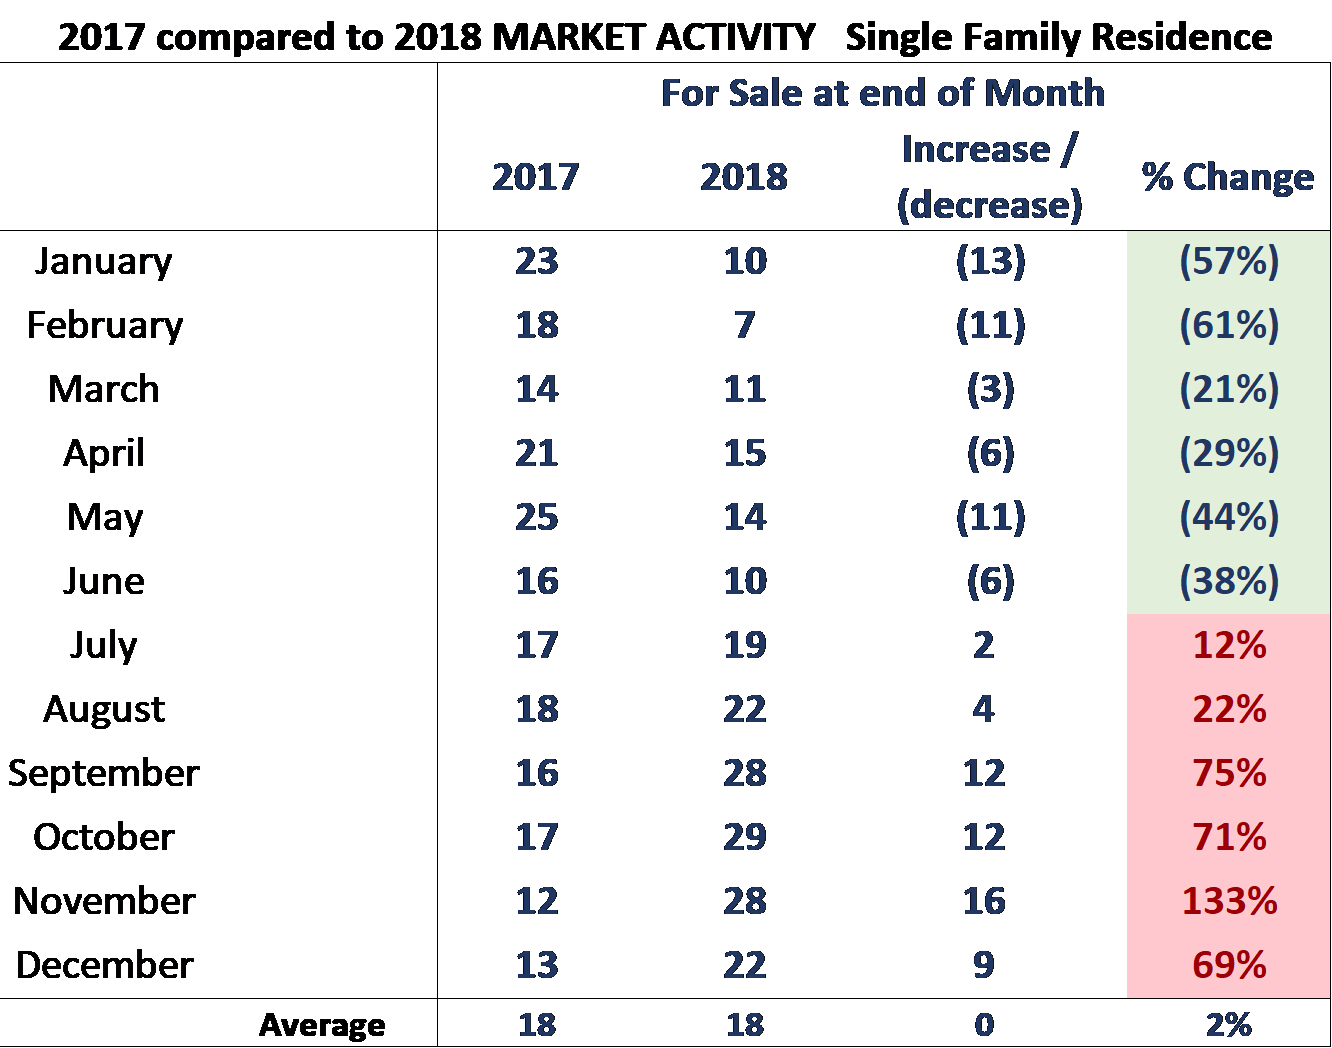
Baker Ranch SFR (Lake Forest)
In Baker Ranch year-over-year inventory has changed as shown below. Red indicates rising Inventory. The majority of the communities experienced similar changes. Note that even though there were sharp increases through the end of the year, at the bottom right of the table the over-all impact was the average monthly inventory ended only 2% above the prior year levels.
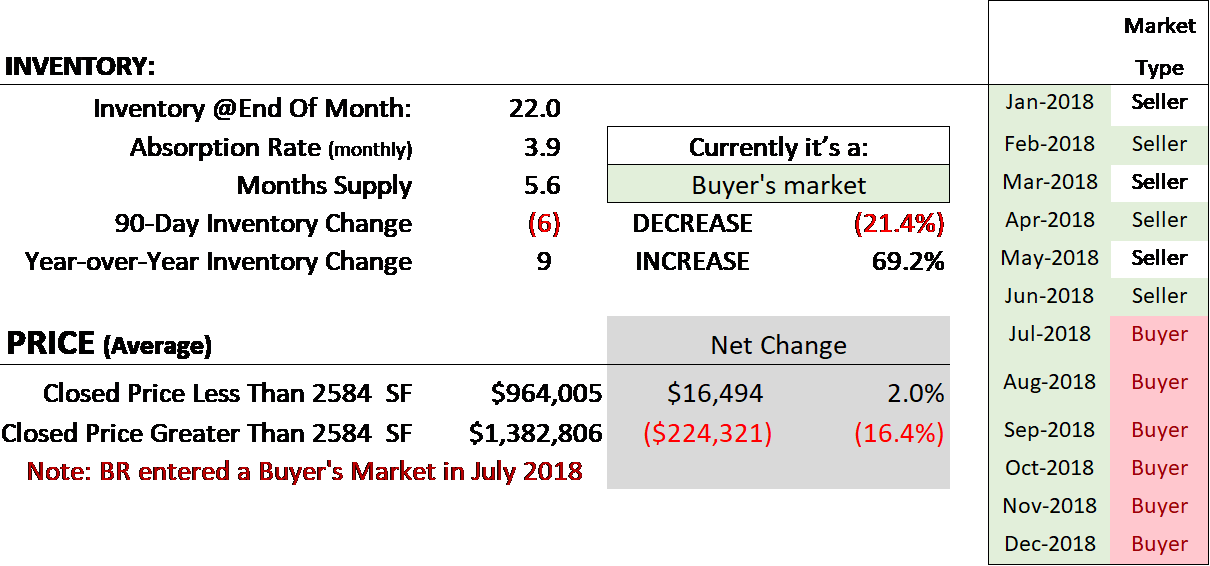
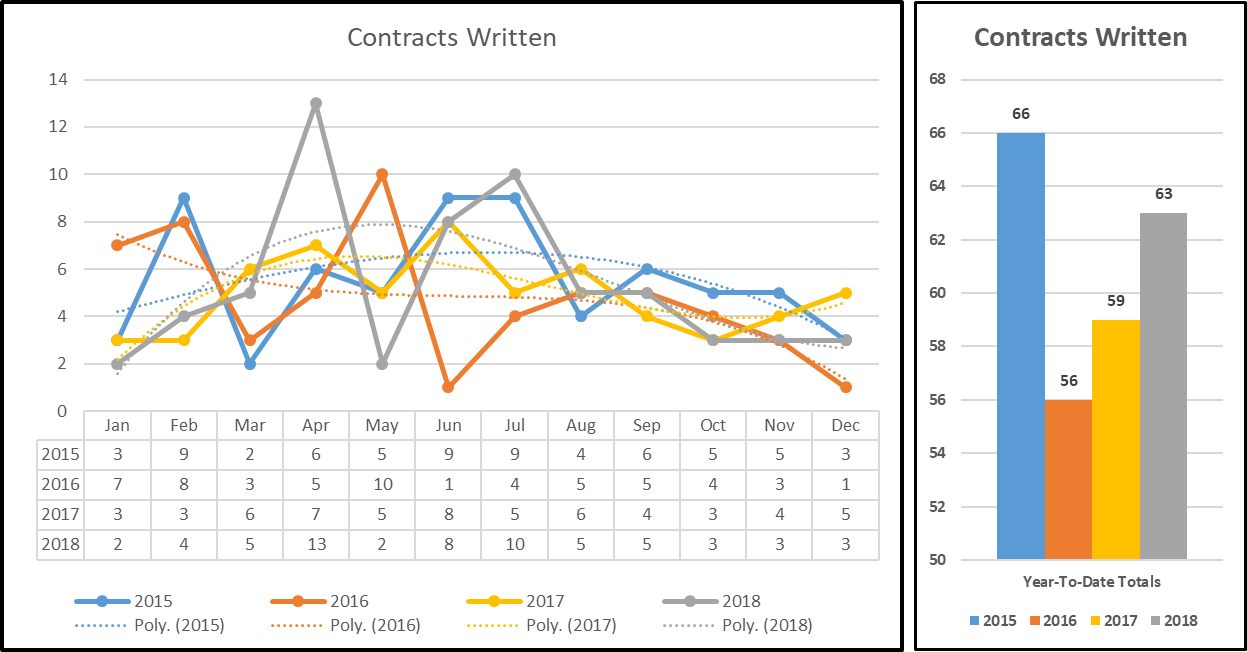
In the second image below note Baker Ranch did finish the year as a Buyer's Market and the average price of homes that sold during 2018 declined.
The image below is taken from our Summary Page for Baker Ranch. It shows BR was stuck in a Buyer’s Market for the last half of the year. The price drop on the larger homes reflects Chapmans relationship between market conditions and pricing.
Woodbridge (Irvine)
By Comparison Woodbridge SFR inventory was also rising and did so throughout the year. It ended up 40% over 2017 levels but still below 2015 levels as seen in the second image (the gray column on the right side of the right chart).
Woodbridge SFR’s New Listings and Contracts Written were strong and the community remained a Seller’s Market throughout the year. Perhaps because of the rising number of homes competing for buyers only minor price appreciation was realized.

CHARTS AND COMMENTARY
Inventory is Rising but remains Moderate or below historical levels just about everywhere.
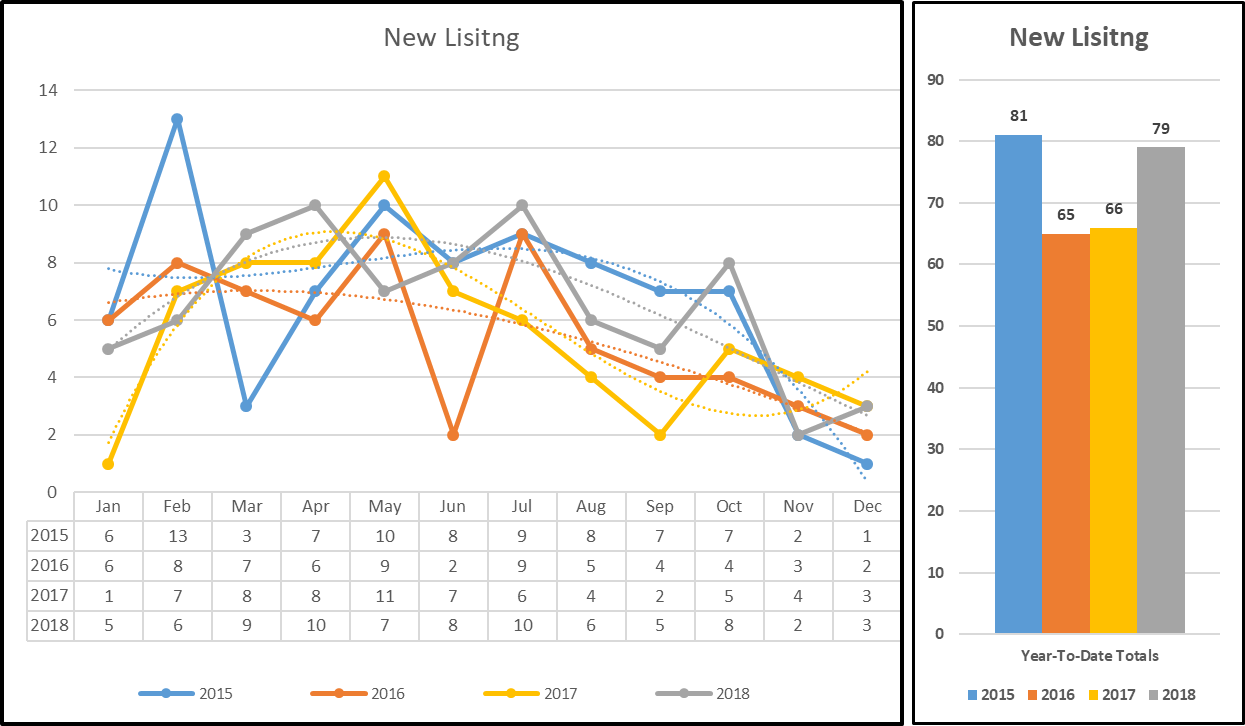
With all the hype about rising inventory we caution everyone to look at the local conditions. As seen in the image below on average the 22 primary market segments we track have inventory below 2015 and 2016 levels. To a very large extent this can be attributed to the very low levels of inventory 2018 started with.
Note in the chart on the left the gray line starts well below the other years but finishes in the grouping with prior years.
The chart on the right (Ladera Ranch SFR from 1500 sf to 3250 sf) shows they ended the year with the lowest average number of inventory units per month available for purchase when compared to the prior 3 years.
Inventory
(Active at End of Month)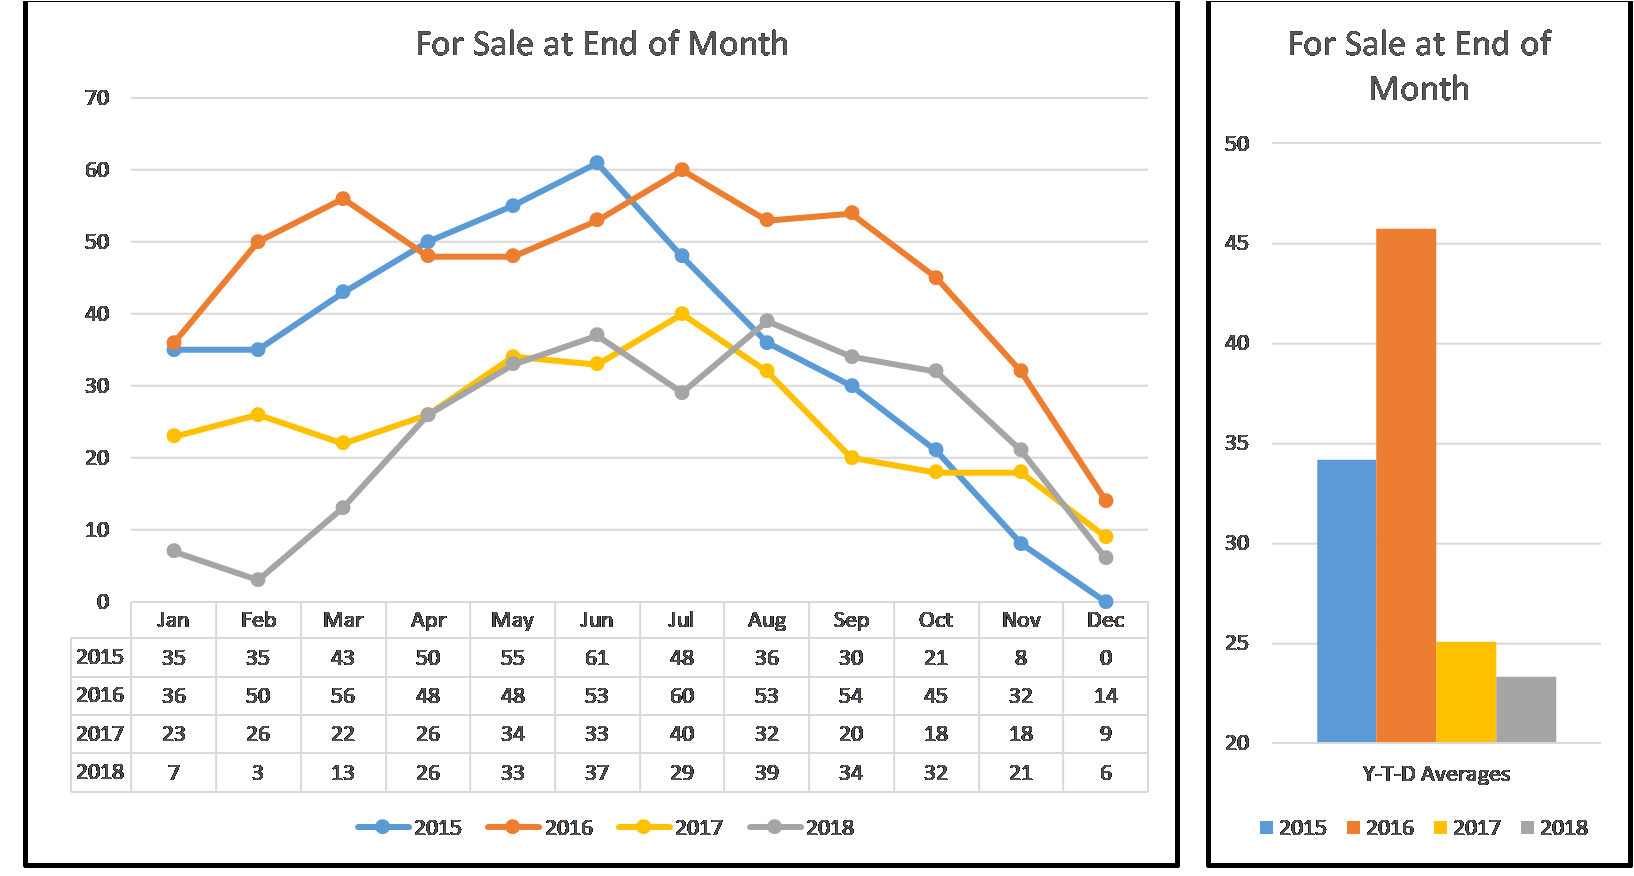
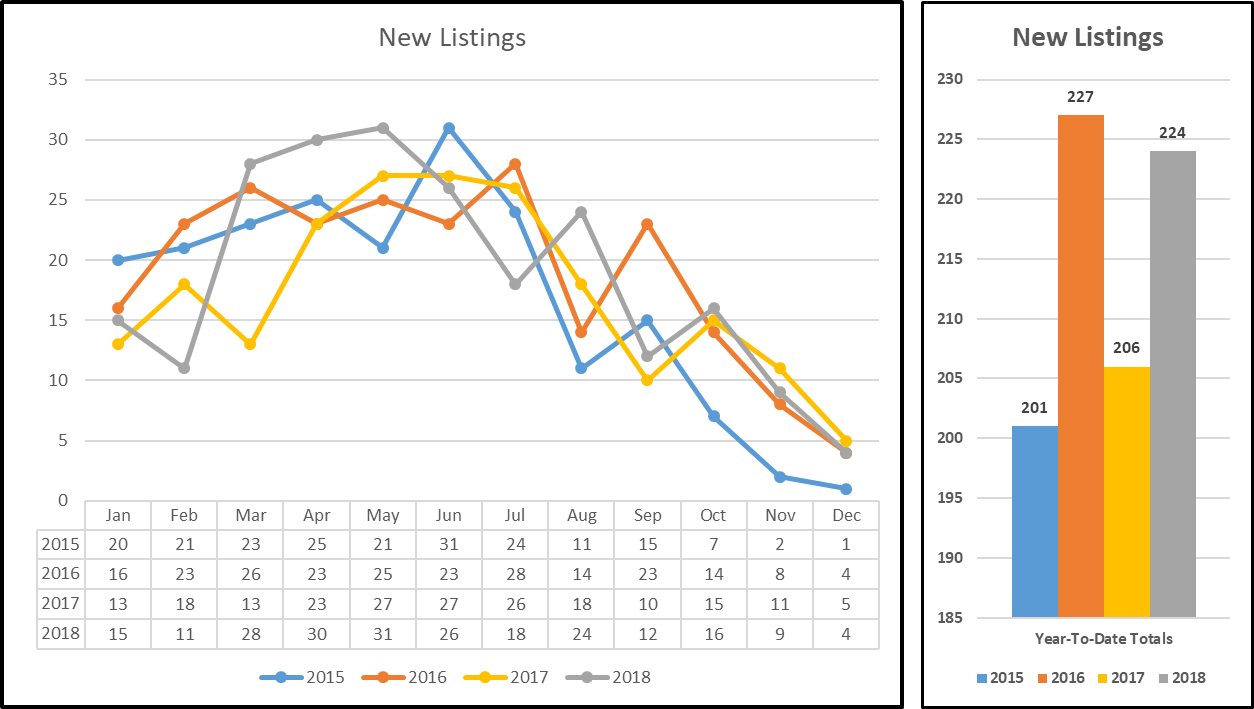
New Listings
Ladera SFR New Listings started off slow as seen in the gray line on the left but quickly surged making 2018 one of the busiest years ever as seen in the gray column on the right. FYI, most communities did not see this large of an increase in new listings.
Contracts Written
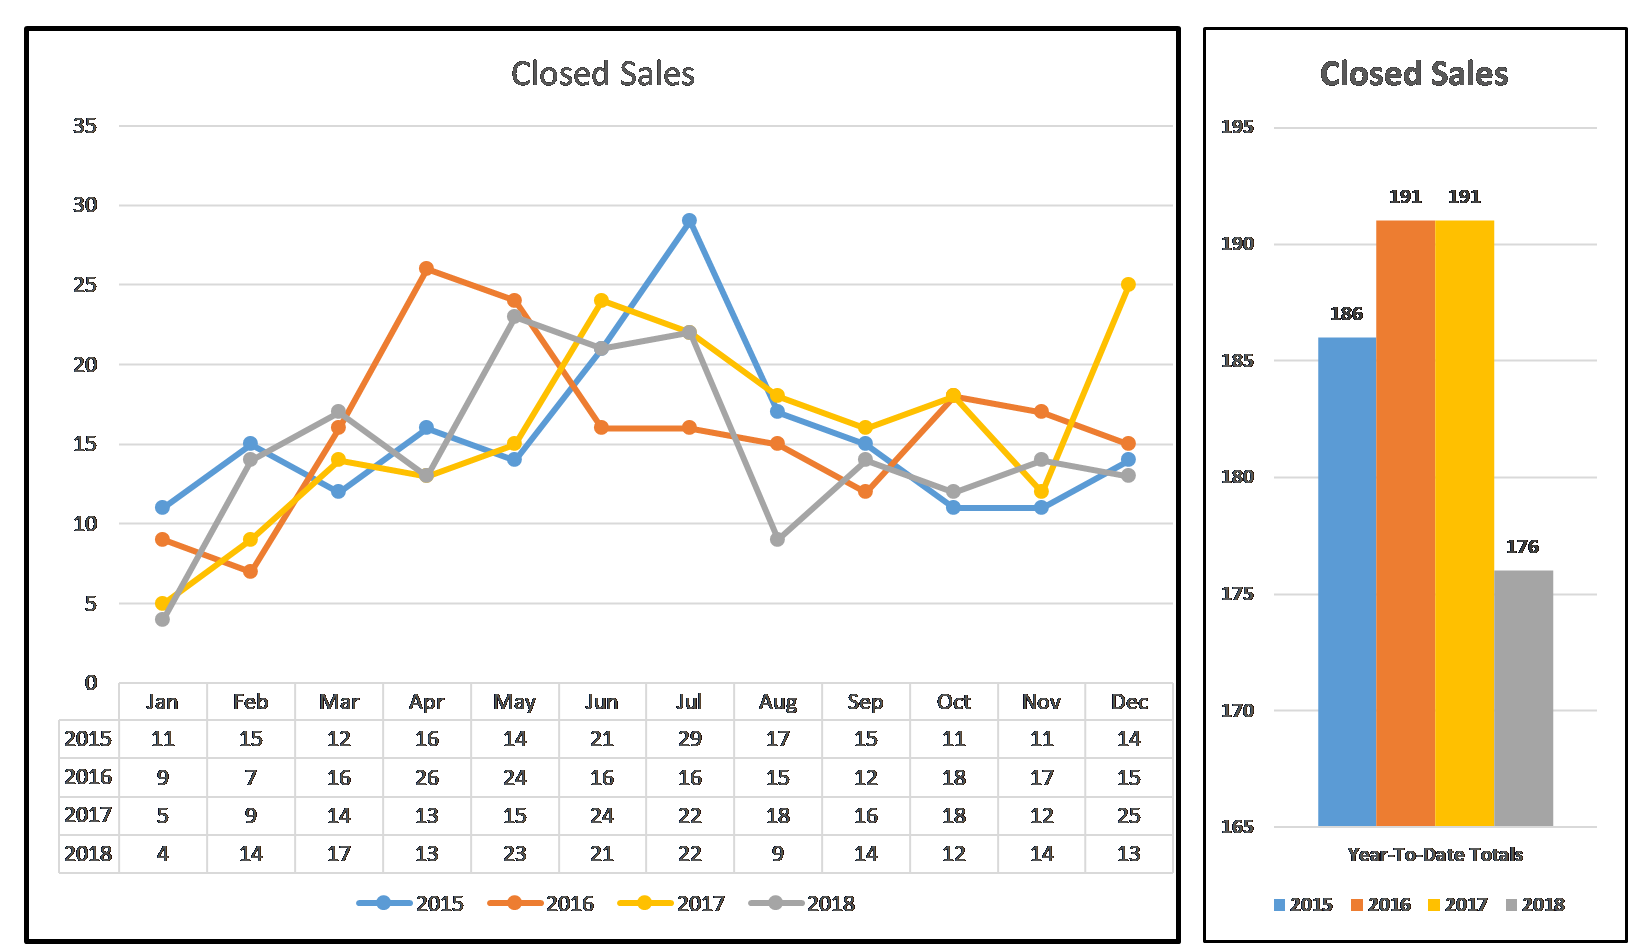
Contracts Written (186) did not keep pace with the New Listings (224). This would be a result of some homes being overpriced or not well presented and the homes that come to market during December not having time to sell.
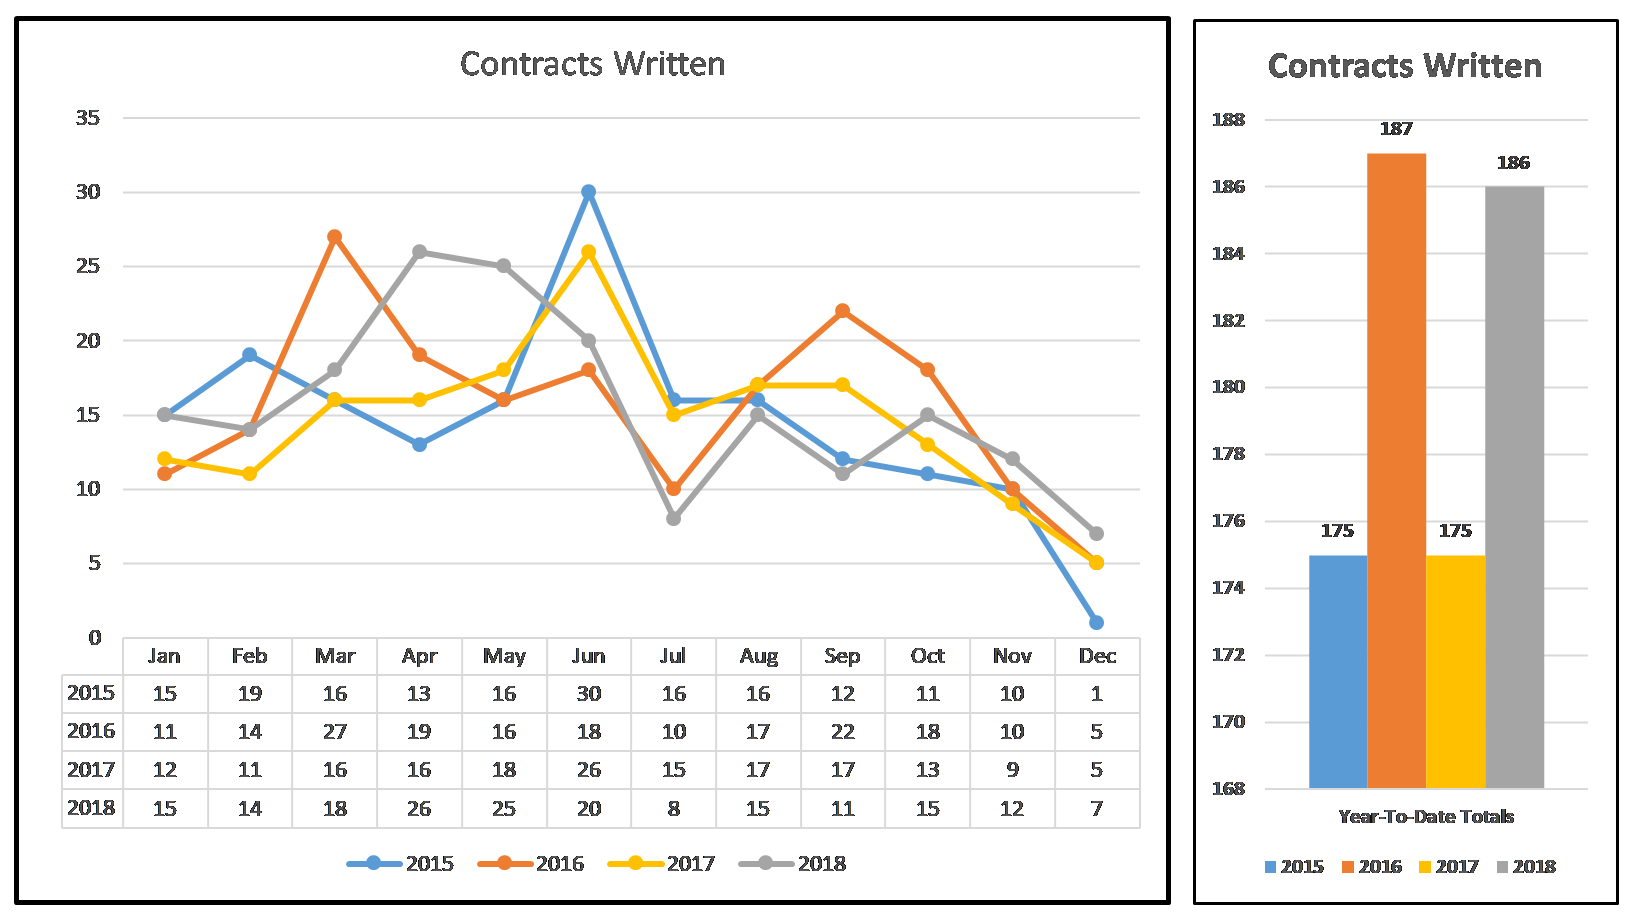
Closed Sales
This seems to show the summary of the market condition. We have plenty of willing sellers (224) and a reasonable proportion of interested buyers (186). It looks like the rising interest rates slowed down the offers and closings.
Our Service
With all that being said we believe 2019 may be the perfect time to trade up or down considering you current home is likely not going to appreciate significantly and prices of any new home you may consider are likely to remain steady for a year or two.
This could be that flat bottom in the market everyone tries to time perfectly.
We are here to help. Please give us a call 949 677-7722 or Email JoeR@HanoverRealtyGroup.com
COMPLETE COMMUNITY REPORTS
Year-End Result for 2018 by community.
Each is a full report for the specific neighborhoods. If you want to discuss the Results for your neighborhood, please contact us. It would be our pleasure to discuss them.
You can find the SUMMARY TABLES that rank each community by activity at this link.
You can sign up for our 90-day Market Snapshot Newsletter for other communities BY CONTACTING US and letting us know which communities are of interest.
AND you can sign up for our Quarterly reports or request custom reports for any city, master plan community, or neighborhood in California.
CLICK on each link to review a community:
- Newport - West Bluff / SAH SFR Single Family Residential (SFR)
- Irvine - Turtle Rock.........SFR 1500 sf & larger
- Irvine - Turtle Rock.........Condo 1100 sf & larger
- Irvine - Woodbridge........SFR 1500 sf & larger
- Irvine - Woodbridge........Condo 1400 sf & larger
- Irvine - WestPark............SFR 900 to 3200 sf
- Irvine - Stonegate...........Condos 1500 sf & larger
- Irvine - Portola Springs....SFR 1500 sf & larger
- Irvine - Portola Springs....Condo 1500 - 3000 sf
- Foothill Ranch.................SFR 1500 sf & larger
- Portola Hills....................SFR 1500 sf & larger
- Coto de Caza...................SFR $600,000 to $999,000
- Coto de Caza...................SFR $1,000,000 to $2,000,000
- Ladera Ranch .................Condo 1100 to 1800 sf
- Ladera Ranch..................Condo 1801 sf & larger
- Ladera Ranch..................SFR 1500 to 3250 sf
- Ladera Ranch..................SFR 3251 to 4800 sf
- Baker Ranch..................SFR 1500 to 4000 sf
- Costa Mesa - West Side 900 to 3000 sf sf
- Robinson Ranch & Rancho Cielo.......SFR
- Dove Canyon.......SFR
We maintain data on about 32 neighborhoods and can develop a report for any neighborhood in California.
Next Report:
Our next newsletter will be in Part 2 of this 3rd Quarter Report and Focused on our regular 18 communites.
What to expect:
- Inventory is rising
- While the entire OC market may remain a Seller's market, there will be areas, most probably the higher end communities, that become Neutral or even Buyer markets.
- Expect to see the new home communities feel the pinch with slower absorptions and softer pricing.
Contact: Joe Richter 949 769-2000
949 677-7722 (cell & text)
JoeR@HanoverRealtyGroup.com
JRichter@HanoverDevelopment.com
Copyright © 2017 · All Rights Reserved · HanoverDevelopment.com
CA CLB B-861134 ~ CalBRE 01744150 ~ CalBRE 01980301 ~ OR REA 201008092