
Orange County 2018 2nd Quarter Market Summary
2018 compared to 2017 in 18 Specific Market Segments
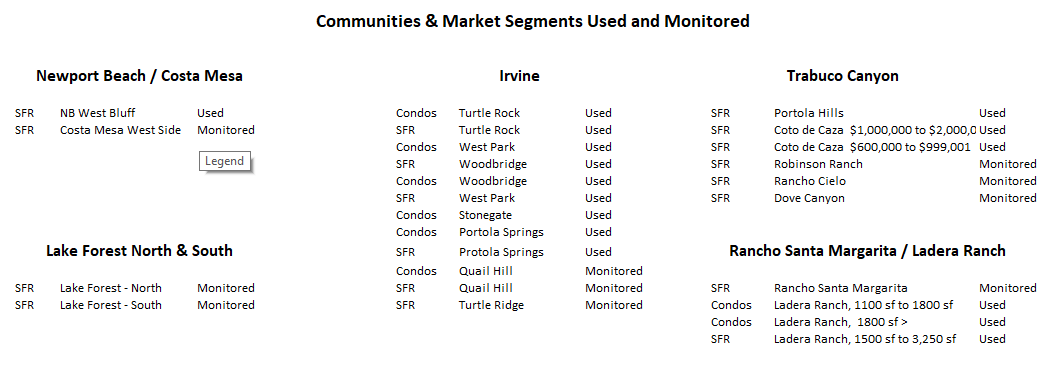
Newport Beach, Irvine, Foothill Ranch, Portola Hills, Coto de Caza, Ladera Ranch, Many Others. Click here to see the entire list.
(PRINTABLE version of this webspage)
INVENTORY LOW ~ New Listings Down ~ Closings Down ~ PRICES aprreciating at a modest rate
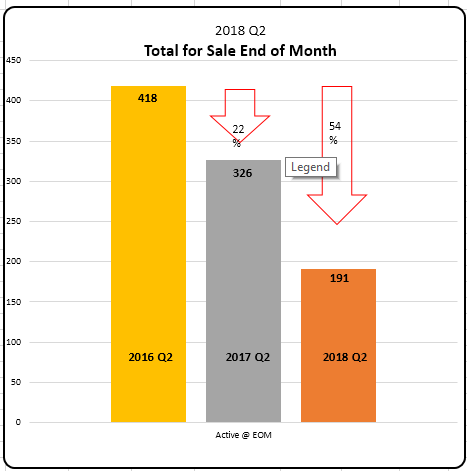
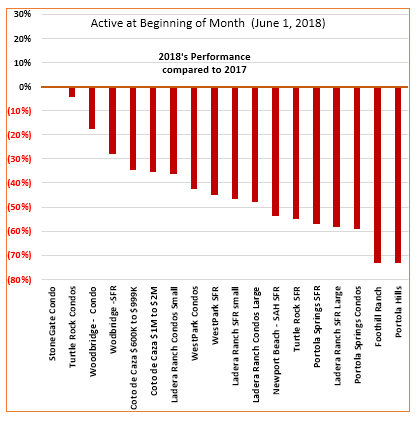
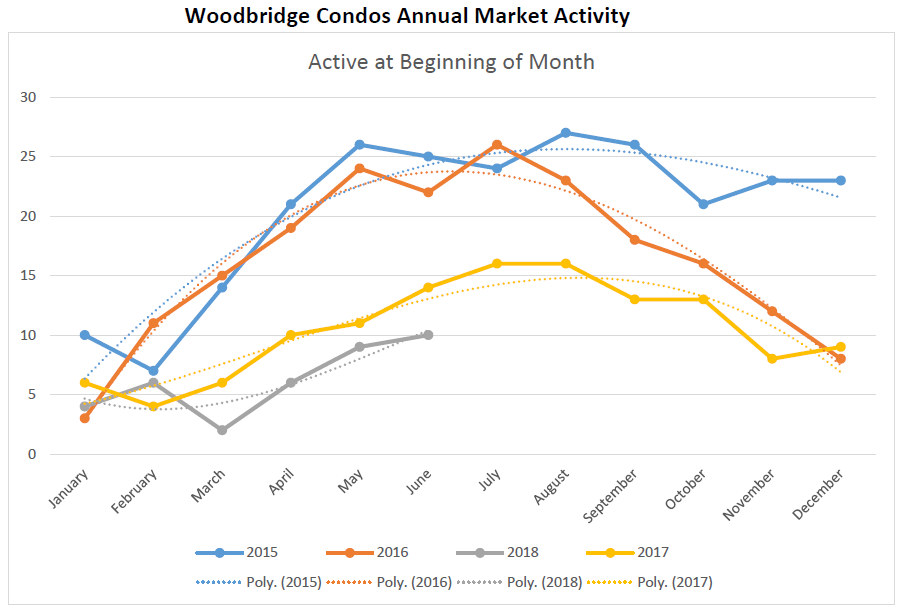
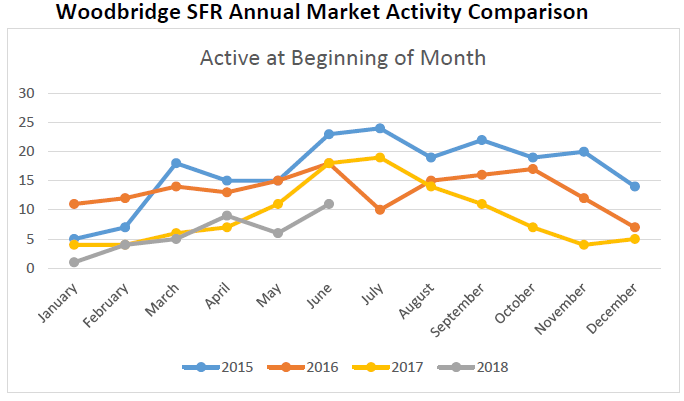
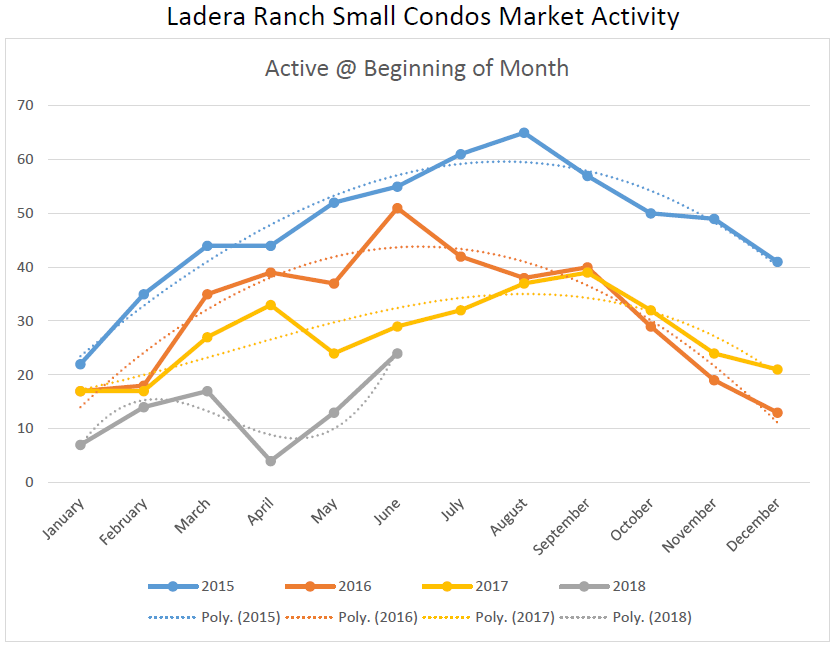
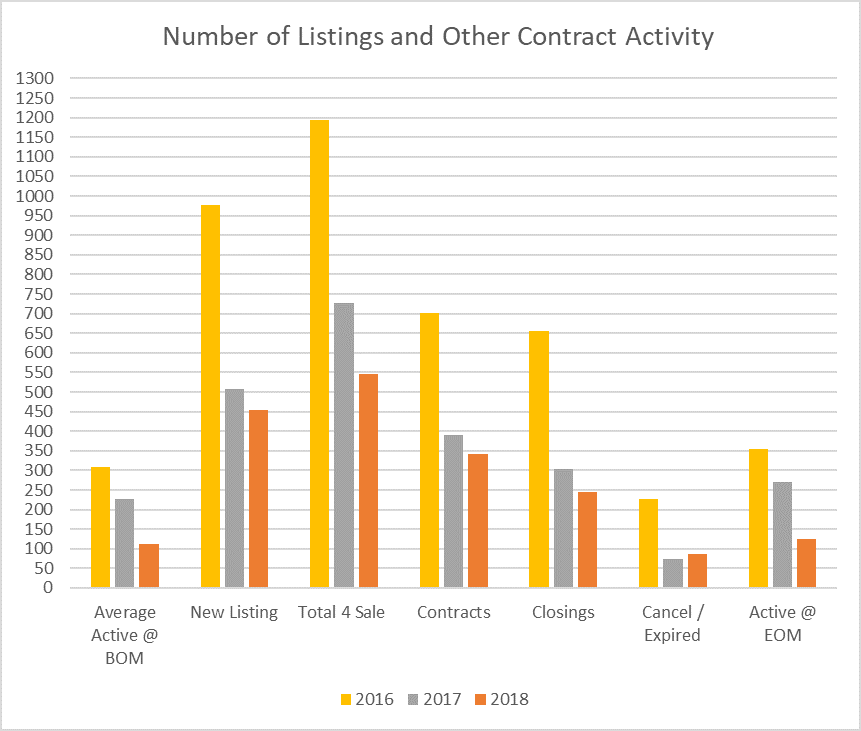
Inventory DOWN 43% (Active at Beginning of the Month)
- Defined as the average number of Active Listings at the beginning of each month;
- June 1, 2018 was down 45% (exclusive of Outliers) from June 1, 2017.
- June 1, 2018 was down 57% from June 1, 2016
- Translation: 17 out of 18 market segments or 94% were down year over year. See the graphs below.
Prices UP 4.1 & 2.4% Respectively
- The smaller sized homes in each product segment saw appreciation of 4.1%.
- The larger sized home in each product segment saw appreciation of 2.4%
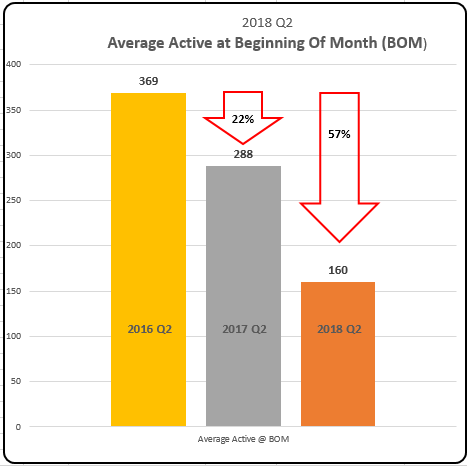
Active at the Beginning Of Month:
- Active Listing at the beginning of June 2018 in every community was down when compared to 2017
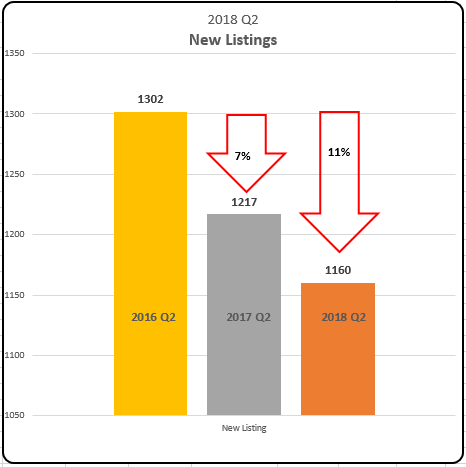
New Listings DOWN 6.5%
- Continuing the trend of fewer homes being offered for sale as a new listing, New Listings were down 6.5% compared to the same period in 2017
- The good news is 6 of the 18 segments were up and 2 others were equal to last year leaving 10 of the 18 (62%) down.
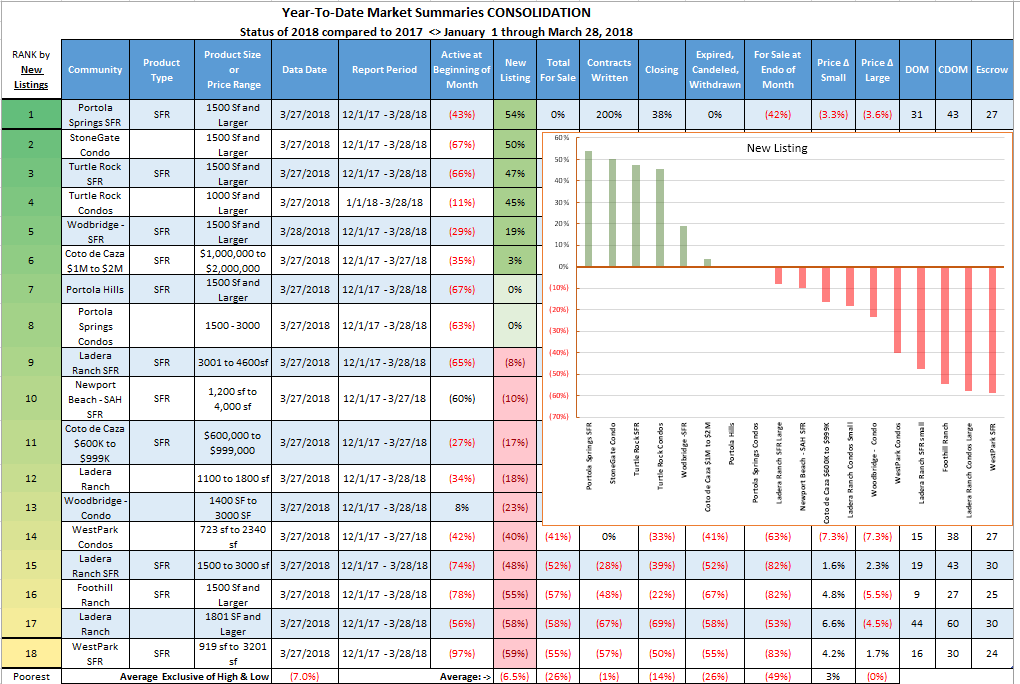
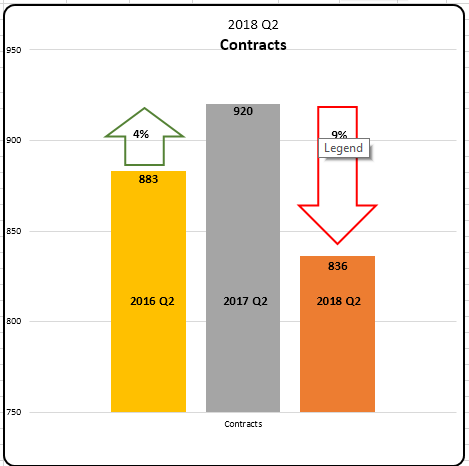
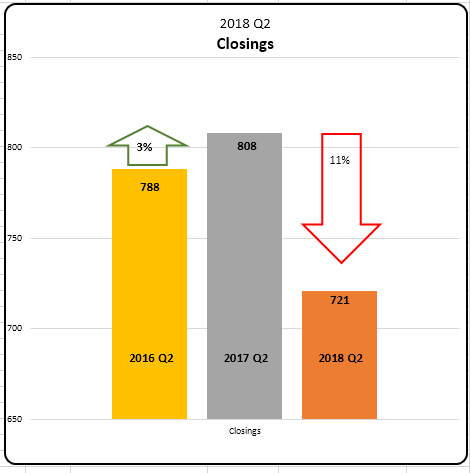
Closings DOWN 14.2%:
- The number of homes that Closed Escrow was DOWN 6.2% (exclusive or outliers), 2.1% inclusive of Outliers. Wha tis an outlier? An outlier is a data point that is out side the range of Standard Deviation. In the graph you can that the first date point is 79% and unusual compared to the other data points. Click here to see the entire package and the calculations of outliers.
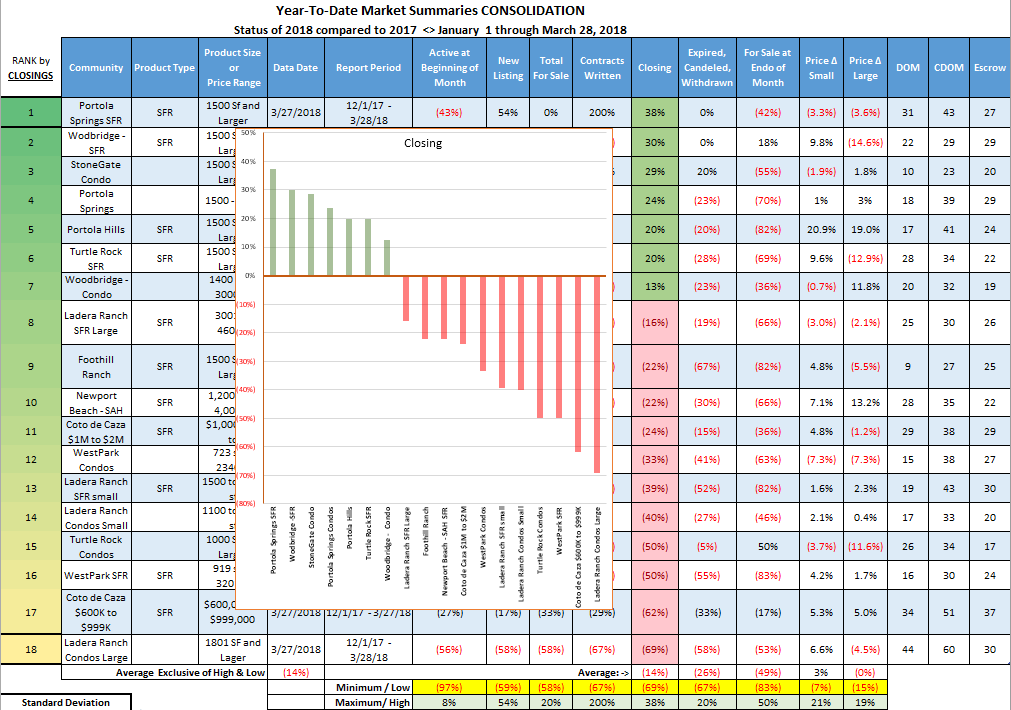
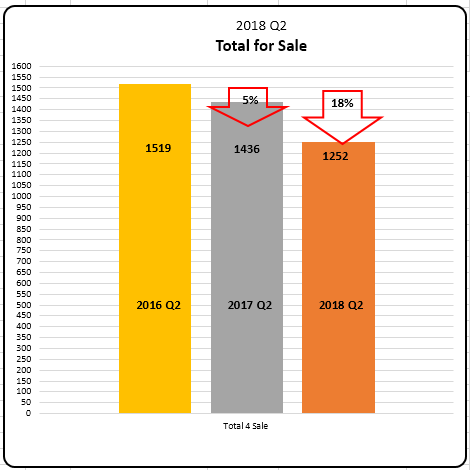
The 3-Year Trend Graph below shows this is the second year in a row with declines in every market activity data field.
Prices on average were:
- Up 4.1% - prices of the smaller sized homes in each community were up an average of 4.1%.
- We look at most market areas as a defined square footage range.
- In Foothill Ranch as an example, we are only comparing single family homes in the square footage range of 1,500 sf to 3,000 sf.
- This range is then divided into a lower and an upper group to compare simialr home segments.
- UP 2.4% - prices of the larger homes in each community were down slightly to start the year.
COMPLETE COMMUNITY REPORTS
2nd Quarter Result for 2018 by community.
Each is a full report for the specific neighborhoods. If you want to discuss the Results for your neighborhood, please contact us. It would be our pleasure to share them.
You can find the SUMMARY TABLES at this link.
You can sign up for our 90-day Market Snapshot at the link beside each by clicking on the Signup Link beside each report.
CLICK on each link to review a community:
- Newport - West Bluff / SAH SFR Single Family Residential (SFR)
- Irvine - Turtle Rock.........SFR 1500 sf & larger
- Irvine - Turtle Rock.........Condo 1100 sf & larger
- Irvine - Woodbridge........SFR 1500 sf & larger
- Irvine - Woodbridge........Condo 1400 sf & larger
- Irvine - WestPark............SFR 900 to 3200 sf
- Irvine - StoneGate...........Condos 1500 sf & larger
- Irvine - Portola Springs....SFR 1500 sf & larger
- Irvine - Portola Springs....Condo 1500 - 3000 sf
- Foothill Ranch.................SFR 1500 sf & larger
- Portola Hills....................SFR 1500 sf & larger
- Coto de Caza...................SFR $600,000 to $999,000
- Coto de Caza...................SFR $1,000,000 to $2,000,000
- Ladera Ranch .................Condo 1100 to 1800 sf
- Ladera Ranch..................Condo 1801 sf & larger
- Ladera Ranch..................SFR 1500 to 3000 sf
- Ladera Ranch..................SFR 3001 to 4650 sf
- Baker Ranch..................SFR 1500 to 4000 sf
- Costa Mesa West Side............SFR 900 to 3,000 sf (call or email for report)
We have data on about 32 neighborhoods and can develop a report for any neighborhood in California.
Next Report:
Our next newsletter will be in May. Our next Market Summary Update report will likely be in July to discuss the activity of the first half of the year.
We do anticipate some increase in interest rates. With the improving economy and job formations we have a factors that can offset and balance the effects of increased interest rates.
Translation:
- Continued low inventory - owners seem content to keep what they have.
- Pricing has been slow so far this year, only the Costa Mesa West Side segment is showing strong price increases.
- Higher interest makes it harder to quality for loans. The demise of Dodd/Frank should improve access to mortgages helping to offset the rising rates.
- Buyers may have fewer options to choose from and get less home for their money.
Contact: Joe Richter 949 769-2000
949 677-7722 (cell & text)
JoeR@HanoverRealtyGroup.com
JRichter@HanoverDevelopment.com
Copyright © 2017 · All Rights Reserved · HanoverDevelopment.com
CA CLB B-861134 ~ CalBRE 01744150 ~ CalBRE 01980301 ~ OR REA 201008092